Top 10 Lithium Ion Battery Pack Manufacturers Worldwide
The global battery market is expanding quickly, but scale alone does not prove engineering quality. According to the International Energy Agency’s Global EV Outlook 2024, electric vehicle battery demand exceeded 750 GWh in 2023, rising by more than 40% in one year. BloombergNEF reported that average lithium-ion battery pack prices fell to $115 per kWh in 2024. These figures show a more competitive market, not an automatically safer one.
This Top 10 review examines lithium ion battery pack manufacturers through practical criteria. Production capacity matters. So do cell chemistry, battery management systems, thermal control, warranty support, recycling plans, and manufacturing traceability. A pack may look impressive on paper yet perform poorly after repeated charging, winter exposure, or heavy commercial use. Small details matter. Connector design matters. Testing discipline matters.
Dr. Shirley Meng, a respected battery scientist, has emphasized that “there is no single battery chemistry that wins every application.” That perspective is useful here. Passenger cars, buses, energy storage systems, and industrial equipment need different compromises. Cost can conflict with cycle life. Higher energy density can increase thermal-management demands. No ranking is perfect. Some manufacturers disclose more data than others, creating an uneven comparison. This introduction therefore treats company claims carefully and prioritizes evidence from technical reports, certifications, field performance, and independent market research. Readers should still verify current specifications, because battery factories, ownership structures, and product platforms can change faster than published rankings.
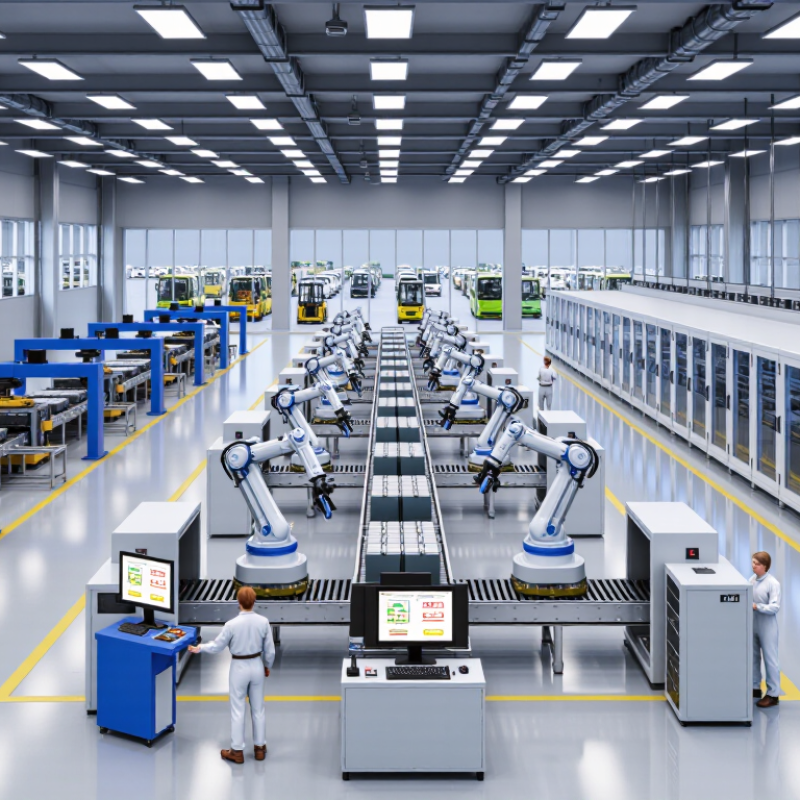
Lithium-Ion Battery Pack Market: Global EV Demand Exceeded 750 GWh in 2023
Top 10 Lithium Ion Battery Pack Manufacturers Worldwide
Lithium-Ion Battery Pack Market: Global EV Demand Exceeded 750 GWh in 2023
Global electric vehicle battery demand exceeded 750 GWh in 2023, according to the International Energy Agency’s Global EV Outlook 2024. That represented roughly 40% annual growth. This surge is reshaping how the top ten battery pack manufacturers are evaluated. Production volume matters, but it cannot tell the whole story. Pack safety, thermal control, charging performance, and supply-chain traceability now carry similar weight.
BloombergNEF’s 2024 Battery Price Survey reported an average lithium-ion pack price of 115 US dollars per kWh. Lower costs improve vehicle affordability, yet aggressive cost reduction can create engineering risks. A reliable pack needs accurate battery management software, balanced cells, strong enclosure protection, and dependable cooling channels. Small design differences can affect range, degradation, and warranty exposure. Real-world testing matters.
Not just factory output.
The strongest manufacturers combine automated assembly with strict quality inspection. They also adapt pack layouts for different vehicle platforms and climates. However, industry rankings remain imperfect. Public reports often compare shipments, while hiding yield rates, field failures, and repair data. This limitation deserves more attention. The next generation of suppliers will likely compete through measurable durability, transparent reporting, and safer high-volume production. IEA data also indicates continued battery demand growth, making manufacturing discipline as important as capacity expansion.
Global EV Battery Demand Surpassed 750 GWh in 2023
Global electric vehicle battery demand grew sharply in 2023. The 2022 figure is an approximate estimate derived from the reported 2023 demand and year-over-year growth; values are rounded. Source: International Energy Agency (IEA), Global EV Outlook 2024.
Ranking the Top 10 Manufacturers by Capacity, Shipments, Safety, and Energy Density
Ranking the top ten lithium-ion battery-pack manufacturers worldwide takes more than comparing factory capacity. Capacity indicates potential output; annual shipments show how many packs reached customers. These measures can diverge when a new production line is still ramping up. Very different.
Safety should be judged through pack-level evidence, not broad claims. Relevant details include thermal management, cell isolation, fault detection, and documented performance under demanding operating conditions. Public safety data is uneven, so missing information should not be mistaken for proof of poor performance. It should, however, limit confidence in a ranking.
Energy density matters when space and weight are constrained, but a higher figure is not automatically better. A compact pack must still manage heat and deliver reliable power over repeated cycles. Comparisons should use consistent units and distinguish pack-level density from cell-level density. Shipment totals also need a clear reporting year. Even a carefully weighted scorecard has blind spots; I would question any ranking that hides its data sources or treats all four measures as equally reliable.
CATL, BYD, LG Energy Solution, and Panasonic: Global Scale Leaders
Global scale in lithium-ion battery manufacturing is not simply a matter of shipping more cells. It depends on repeatable production, access to materials, and the ability to serve vehicle and energy-storage markets. Large manufacturers can spread research and factory costs across high output. Their advantages show up in practical details: consistent cell dimensions, reliable pack assembly, and fewer supply interruptions. Scale is not enough.
At pack level, engineering choices shape driving range, charging speed, service life, and safety. A well-designed system coordinates cells, cooling plates, sensors, and battery-management software. Small variations in welds or thermal contact can matter. Very much. Buyers should compare verified performance, warranty terms, recycling plans, and local service—not production capacity alone. Published figures may describe planned output, rather than batteries already leaving the line.
Regional manufacturing also matters. Plants near vehicle assembly sites can shorten delivery routes and make technical support easier. Local sourcing may reduce exposure to shipping delays, though it cannot remove every supply risk. Factory expansion is expensive, and new capacity can outpace demand. Operators can learn more from service records covering hot summers, cold winters, and repeated fast charging than from a headline production figure alone.
SK On, Samsung SDI, CALB, EVE, Northvolt, and Gotion: Regional Challengers
Regional challengers are reshaping the battery-pack landscape through local production, targeted partnerships, and distinct product strategies. The International Energy Agency’s Global EV Outlook 2025 estimates that China produced nearly 80% of the world’s battery cells in 2024. That concentration leaves room for Korean, European, and other Asian producers to compete on supply security and proximity to vehicle factories. A battery made closer to an assembly line can reduce shipping distance and simplify coordination.
Scale still matters. SNE Research reported that global electric-vehicle battery usage reached 894.4 GWh in 2024, up 27.2% year over year. This expanding market gives regional challengers opportunities to win contracts, but announced capacity is not the same as cells shipped. A new factory may look impressive on paper. Production yields, reliable materials, and consistent quality determine whether it can deliver at scale.
Regional strengths differ. Korean producers bring experience supplying global automakers, while European ventures are building local manufacturing networks. Chinese challengers often benefit from deep supplier ecosystems and fast-growing domestic demand. Yet pack comparisons can be misleading: chemistry, usable energy, warranty terms, and testing methods vary. The figures deserve caution. Growth is real, but market-share claims should be checked against shipment data, not factory plans alone.
LFP and NMC Chemistry: Nearly 40% Versus 60% of EV Batteries in 2023
In 2023, LFP chemistry supplied nearly 40% of electric vehicle batteries, while NMC accounted for about 60%. The figures describe a broad market balance, not a fixed recipe for every vehicle. Dataset coverage and rounding can shift the exact shares. Still, the contrast matters to lithium-ion battery pack manufacturers worldwide. LFP avoids nickel and cobalt, and can support cost-conscious designs. NMC often offers greater energy density, which helps when space and driving range are tight. Trade-offs remain.
Tips: Compare complete pack specifications, not chemistry labels alone. Check usable energy, temperature controls, charging limits, and warranty terms. A small detail matters: a cold morning can affect charging behavior and available power. Ask how the pack performs under your expected climate and duty cycle.
The 40-to-60 split should not be read as a simple winner ranking. Cell chemistry is only one part of pack performance; cell format, cooling, software, and vehicle design also matter. LFP packs may need more volume for similar stored energy, while NMC systems require careful thermal management. Those are tendencies, not guarantees. Buyers and engineers should compare tested, like-for-like packs. It is easy to overstate what one market percentage can tell us.